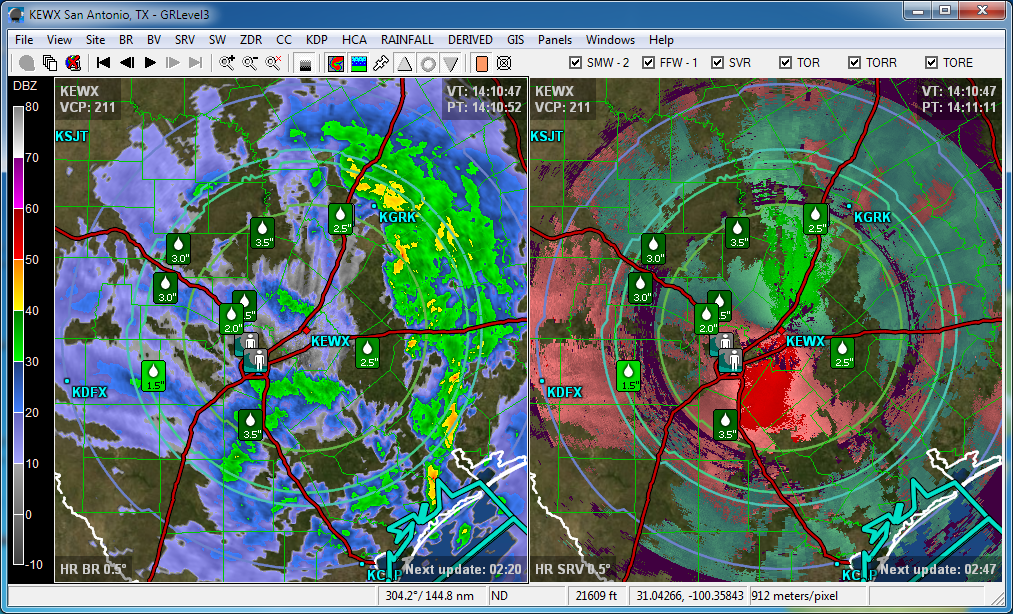
The main window contains a main menu along the top, toolbar underneath, color table on the left, radar display window in the center, and the status bar along the bottom. Many layers of information are shown in the radar display window (from back to front order): background color, automatic background imagery, radar graphical data, county outlines, state outlines, roads, city labels, radar labels, LSR icons, warning outlines, storm tracks, hail icons, NMD/MESO icons, and finally TVS icons. If the automatic background is enabled (via GIS->Show Background) you will see increasing levels of detail as you zoom into the radar display. See the Automatic Background page for more details.
The radar display window is the centerpiece of GRLevel3. By default it contains a single display panel but can display one, two, or four panels. Each display panel shows radar data, LSRs, warnings, and other graphical information. All of the panels are linked together, so panning and zooming occurs simultaneously in all of them. In the screenshot above, BR 0.5° is the product shown in Panel #1 on the left and SRV 0.5° is the product shown in Panel #2 on the right. In the four corners of each panel is information about the data: the upper-left shows the radar and VCP, the upper-right contains the Volume and Product Times, the lower-left shows the exact product displayed, and the lower-right shows the amount of time until the the next update is expected.
To change the number of display panels shown, click the "Panels" main menu item and select "One Panel", "Two Panels", or "Four Panels". Below those items are the saved Favorite Panel configurations. There are eight saved Favorite Panel configurations available and they default to a variety of useful combinations. There are two ways to switch to a saved Favorite Panel configuration: select it from the Panels menu or press the corresponding number key on your keyboard. To replace a saved Favorite Panel configuration with the current displayed panels, select Panels->Save Current Panels as->Favorite #N, where N is the saved configuration to replace.
To pan the display, click and drag with the left mouse button. To zoom in, roll your mousewheel forward or click on the + magnifying glass button in the toolbar. To zoom out, roll your mousewheel backwards or click on the - magnifying glass button in the toolbar. To zoom in on a specific area, right-click on the location you want centered and drag outwards. A zoom box will appear showing the extent of the new view area. Release the right mouse button to activate the new zoom area. To cancel the right-click zoom operation, press the Esc key before releasing the right mouse button.
Base Reflectivity 0.5° is the default radar data product. To select a different product, click on the product's category in the main menu (e.g. BR, BV, SRV, etc.) and select the specific product of interest from the submenu. GRLevel3 automatically starts and stops polling for products as you switch between them.
See the Radar Products page for more information on the radar products available in GRLevel3 2.00.
GRLevel3 defaults to KFFC (Atlanta's radar) on first run. There are two ways to change to a different radar site:
You can change the startup site by selecting Site->Settings... to display the Site Settings dialog box. Click on the "Change" button in the "Startup Site" section and select your new startup site.
Radar sites can also be added to a "Favorites" list at the bottom of the "Site" main menu item. To add a new site to your Favorites, go to the site and then select Site->Add To Favorites. To change to a Favorite site, simply select it from the Site menu. To remove a site from your Favorites, select Site->Settings and remove it from the Favorites list.
GRLevel3 downloads warnings for the entire nation. Only severe weather warnings are supported: Special Marine, Flash Flood, Severe Thunderstorm, and Tornado. GRLevel3 shows a priority-sorted list in the "Active Warnings" window and the warning outline in the radar display window. You can see the statements for a warning in two ways: click on the warning outline in the radar display or right-click on the warning's entry in the Active Warnings window. To automatically change to the closest radar site to a warning, double-click on the warning's entry in the Active Warnings window. See the Warning System page for more information.
GRLevel3 downloads Local Storm Reports from the public NWS server. Icons representing the type and magnitude of an LSR are shown in the radar display. Hover your mouse pointer over an LSR icon to see details of the report. Only LSRs issued within 60 minutes of the currently displayed product's volume scan time are shown.
The GRLevel3 status bar contains mouse pointer information and the current zoom level. The mouse pointer information changes with movement of the pointer.
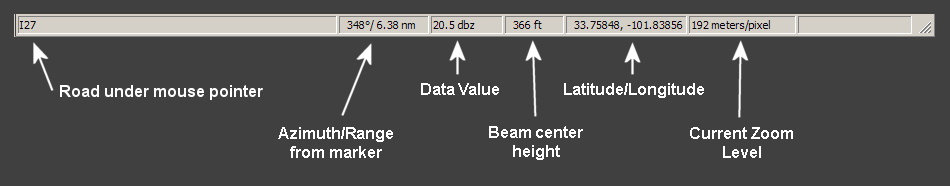
The individual items on the status bar are:
Storm Attributes are automatically downloaded and displayed on top of the radar data. There are Tornado Vortex Signature (TVS) icons, Elevated TVS icons (ETVS), New Mesocyclone Detection (NMD) icons, legacy Mesocyclone Detection (MESO) icons, and Hail Size icons.
|
|
TVS Icons The TVS iconsheet has two rows of ten icons. The icons represent the tens digit(s) of the TVS Low-Level Delta Velocity (LLDV) in knots. For example, the "19" icon indicates that LLDV was at least 190 kts.
|
|
|
ETVS Default Icon
|
|
|
NMD Icons The NMD iconsheet has two rows of five icons. The top row is shown when the mesocyclone does not extend down to the lowest velocity tilt. The NMD Strength Rank is used to select the column via the equation: (SR-1)/2.
|
|
|
MESO Icons The MESO iconsheet is shown on legacy volume scans. There are two icons: 2D detection and 3D detection.
|
|
|
Hail Icons The Hail iconsheet has five rows of four icons. Each row corresponds to the inches in the estimated hail size. Each column represents 0.25" increments. |
You can change any of the iconsheets in GRLevel3 to your own customized versions. See the following page: Iconsheets in GR Programs.
You can change any of the color tables used by GRLevel3 to your own custom versions. See the following page: Color Tables in GR Programs.