GREarth's radar mosaic is a 1km resolution, CONUS-wide, lowest altitude mosaic of high resolution Level III data that updates every 5 minutes. It is available in raw and quality controlled format. Basic specifications:
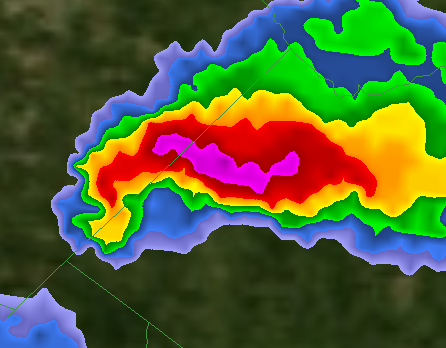
GREarth's radar mosaic is created from the 0.5° radar tilt. It is sampled every 1km. The use of the lowest tilt preserves critical low-level features such as hooks and outflow boundaries. The result is a high quality, high resolution mosaic that rivals dedicated Level III radar programs. For example, here is an example of a hook as shown in GRLevel3:
And here is the same hook as shown in GREarth:
GREarth uses a multiresolution tiled architecture to reduce bandwidth usage. The base radar mosaic is a 5440x3280 array of 1km samples. This base mosaic is broken up into 512x512 tiles so that only the region you're viewing needs to be downloaded. In addition, the GREarth server derives power-averaged 2km and 4km tiled arrays. GREarth switches between the various resolutions automatically based on the view zoom level.
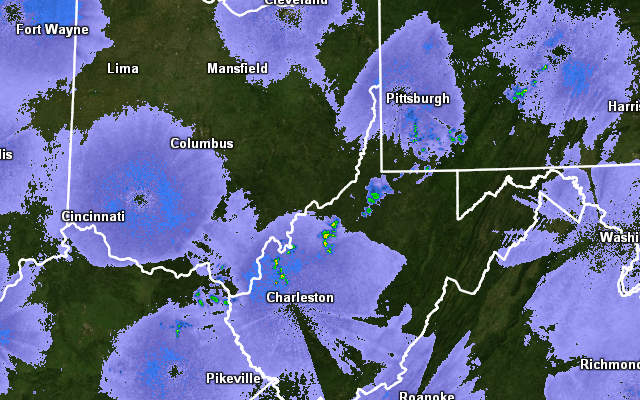
The GREarth server combines the raw radar mosaic with RUC temperature, RUC cloud base, and Echo Tops data to remove most of the ground clutter and anomalous propagation noise. For example, here is a raw radar view showing large areas of GC+AP:
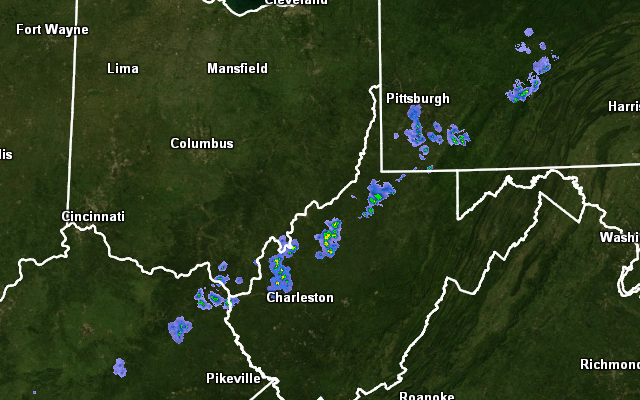
And here is the same view after the QC algorithm has removed most of the false echoes:
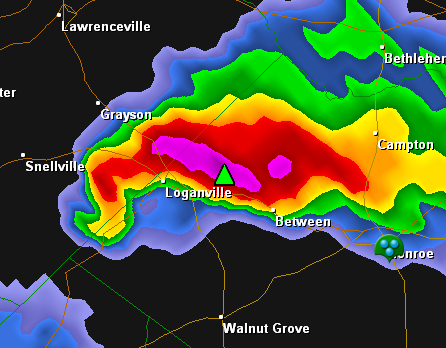
GREarth shows significant storm attributes across the nation. These attributes are derived from the Storm Attribute table in the Level III Composite Reflectivity products. Here is an example of the storm attribute display:
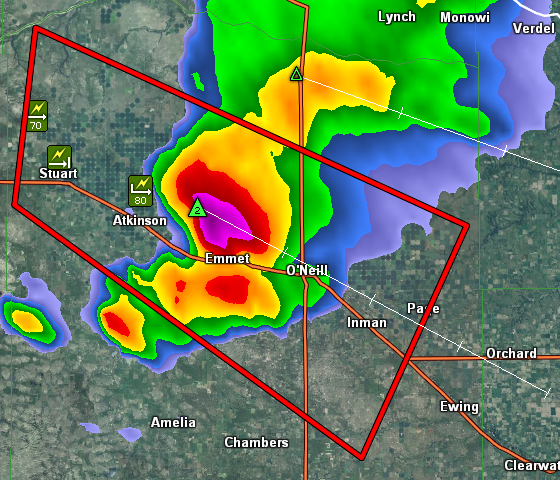
The cell's position is given by the large, green triangle icon. The "2" in the hail icon indicates that the NEXRAD Hail Algorithm derived a MEHS of between 2 and 3 inches. The NEXRAD storm track is shown as a thin white line with tick marks at 15 minute intervals, for a total track length of one hour.
In order to reduce the large number of attributes generated by the NEXRAD algorithms, GREarth only shows intense cells. Those that meet any of the following criteria:
GREarth can apply precipitation typing to both the raw and QC radar data for display. The GREarth server generates a new precipitation type data field every five minutes by interpolating the RUC 13km model output. The algorithm is based on the Canadian "Energy" method that has been modified to produce probabilities for rain, freezing rain, sleet, and snow. These probabilities are combined with the radar mosaic in a novel rendering technique to show mixtures of types in real time. Here is an example showing all the precip types overlaid with METAR Present Weather icons:
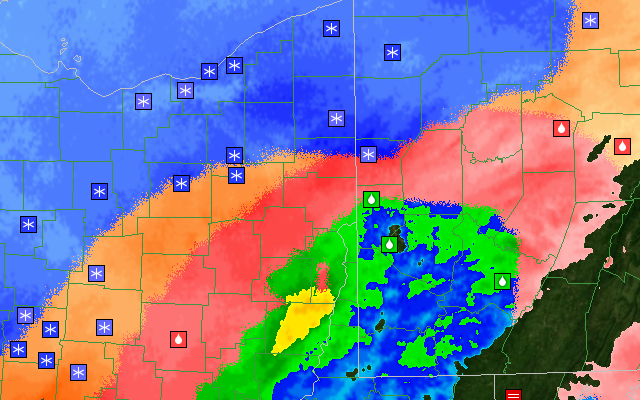
The large blue area in the upper-left is all snow, the orange areas are sleet, red areas indicate freezing rain, and the regular reflectivity color area is all rain. At the current time, the precipitation typing algorithm is completely dependent on the accuracy of the RUC model.