GREarth displays information from the National Hurricane Center on top of the radar and satellite data.
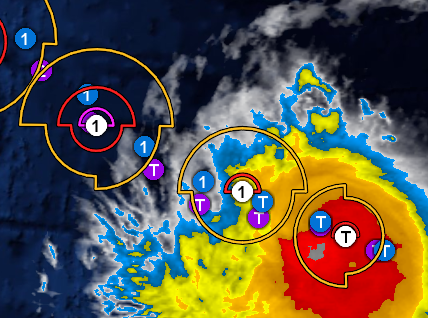
Here is an example of the NHC official tracks and hurricane model output:
The official NHC track is shown as the Saffir-Simpson Wind Category on a white circle. The track positions are every 12 hours for 48 hours and then a final 24 hour increment for day three. The wind categories are:
|
D |
less than 34 kts |
|
T |
34 - 63 kts |
|
1 |
64 - 82 kts |
|
2 |
83 - 95 kts |
|
3 |
96 - 113 kts |
|
4 |
114 - 135 kts |
|
5 |
greater than 135 kts |
The official NHC wind radii forecasts are shown as colored lines at given distance from the center for each quadrant (NE, SE, SW, NW). There are three potential radii in each quadrant:
|
orange line |
34 kts |
|
red line |
50 kts |
|
purple line |
64 kts |
The hurricane models are shown as wind category icons. The icons from the HWRF model have a blue background. The icons for the GFDL model have a purple background. Positions are plotted every 6 hours and can extend up to 126 hours from the model run time.
Hover your mouse pointer over any of these icons for complete track and forecast details.
Here is an example of the NHC recon flight output:
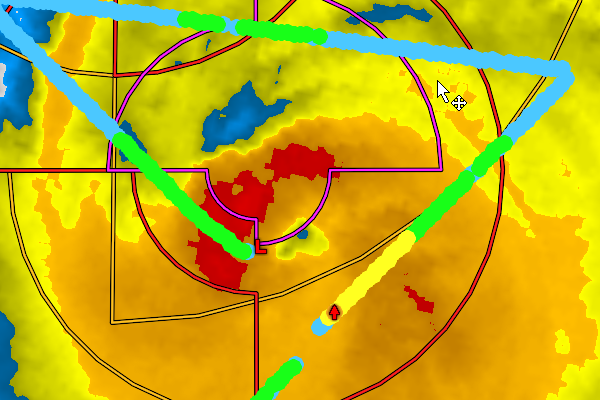
Each icon in the recon display corresponds to a single HDOB report and the color indicates the maximum surface wind speed:
|
light blue |
less than 34 kts |
|
blue |
34 - 50 kts |
|
green |
50 - 63 kts |
|
yellow |
64 - 82 kts |
|
orange |
83 - 95 kts |
|
red |
96 - 113 kts |
|
purple |
114 - 134 kts |
|
dark purple |
greater than 134 kts |
GREarth analyzes the recon data and places a red "L" icon on the lowest reported surface pressure and a red arrow on the highest reported surface wind speed. Vortex Data Messages are shown with a red "V" icon.
Hover your mouse pointer over any of these icons to see complete report details.