GREarth displays several severe weather and standard surface/upper air mesoanalysis fields. There are three rendering methods: color-filled graphical underlays, contour line overlays, and iconic overlays. All mesoanalysis fields are derived from the 13 km RUC hourly model using the virtual temperature correction.
GREarth 1.00 can display one of 16 color-filled underlay graphics:
Descriptions of many of these parameters are available on the Storm Prediction Center's excellent Mesoanalysis Help page.
It's important to note that the severe weather parameters will be close to but not exactly the same as those shown on the SPC Mesoanalysis pages. GREarth uses just the RUC model output for all calculations while the SPC combines the RUC with observations, which can lead to differences when the lower levels of the atmosphere are not adequately captured by the RUC model.
GREarth 1.00 can display several mesoanalysis overlays simultaneously:
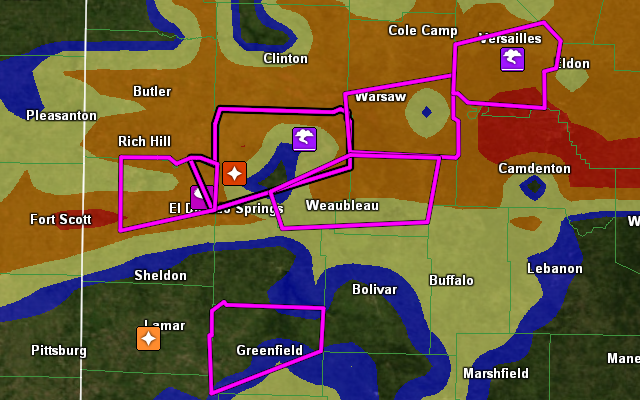
GREarth's Severe and Tornado Hazard color fills are proprietary graphical fields that show where the RUC model indicates the potential for severe weather in the next three hours. The GREarth server calculates the SCP and STP for three forecast hours and combines those fields with the RUC forecast reflectivity. The result are fields showing where there will be both the right forecast environment and high forecast reflectivity. Here is a real-time example showing the TORH underlay with existing tornado warnings overlaid (radar data not displayed):
Note how the tornado warnings and tornado/funnel cloud LSRs are within the hazard areas indicated by the higher TORH values.