Load Shapefile...
Displays the Load Shapefile dialog box:
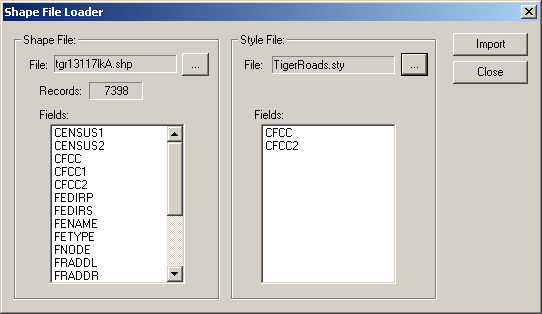
Choose a shapefile to load by clicking on the "..." button in the Shape File section. The number of shape records and field names are displayed. Next, choose a import style file by clicking on the "..." button in the Style File section. The field names in the style file are displayed. Click on the Import button to import the shapefile with the selected style file. The dialog box remains open so that multiple shapefiles can be opened easily. Click on the Close button to close the dialog box. See the Style File Specification for more information.
Unload Shapefile...
Displays the Unload Shapefile dialog box:
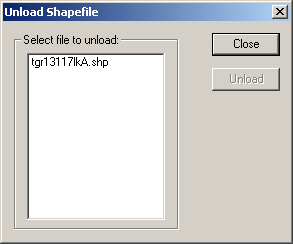
Select the shapefile to unload in the listbox then click on Unload to remove it from the list. Click on Close to close the dialog box.
Manage
Places...
Displays the Manage Placefiles dialog box:
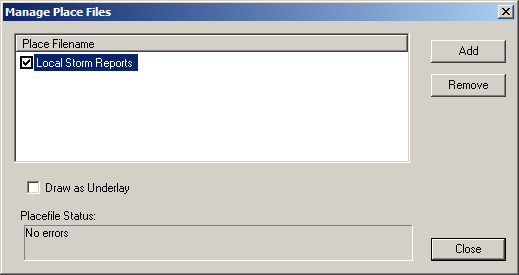
Click on the Add button to display a dialog box and enter a placefile name. Local, remote, and internet filenames are supported. Select a placefile then click Remove to remove the placefile from the list. The "Draw as Underlay" checkbox causes the placefile to be drawn below the radar display. The "Placefile Status" text shows any errors found while parsing the selected placefile. This is useful in debugging the placefile content. See the Place File Specification for more information.
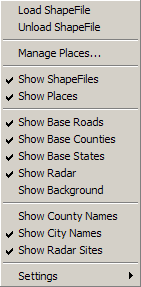
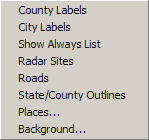
Show [layer]
Show menu items determine which GIS layers are drawn. If a layer isn't
available, e.g.. the background bitmap, its menu item will be disabled.
Settings
The Settings menu items control the presentation of the GIS layers:
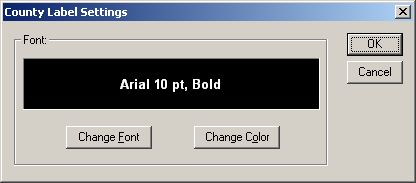
County Labels...
Displays the County Label Settings dialog box:
Clicking on Change Font displays the standard Select Font dialog box. Clicking on Change Color displays the standard Choose Color dialog box. Press OK to use the new settings. Cancel discards changes.
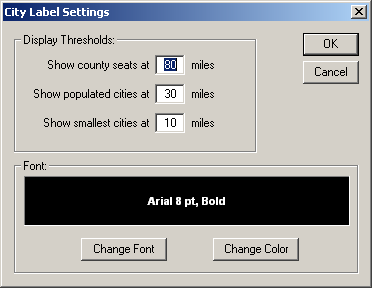
City Labels...
Displays the City Label Settings dialog box:
Progressive disclosure of the base cities by their attributes is supported. When the height of the radar display is less than or equal to the threshold, the city name is displayed in the specified font and color.
The font and color buttons work similar to those in the County Labels dialog box.
Places...
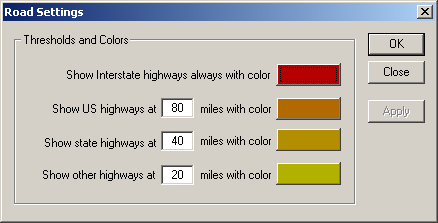
Displays the standard Choose Font dialog. This font is used to draw Place labels on the radar display. The place file specifies the threshold and color of the labels.Roads...
Displays the Road Settings dialog:
Progressive disclosure of the base roads by their attributes is supported. When the height of the radar display is less than or equal to the threshold, the road is drawn in the specified color. Click on the Apply button to see the changes without closing the dialog.
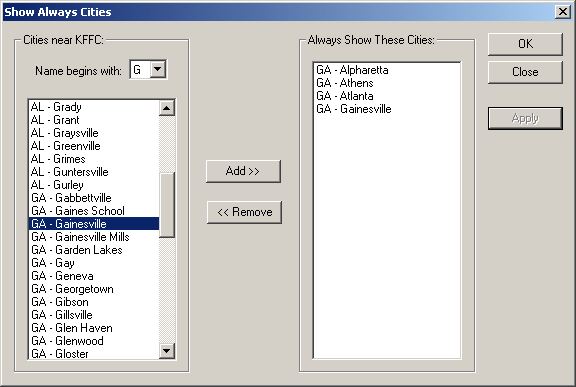
Show Always List...
Displays the Show Always Cities dialog:
To add a city to the show always list, select the first letter of the city's name then scroll through the list to find it. Double-click on the name or click Add to add it to the always list. To remove a city from the list, double-click on it or select it and press Remove. Click the Apply button to see the changes without exiting the dialog. Show Always Cities are stored on a per-radar site basis.
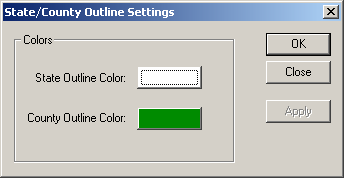
State/County Outlines...
Displays the State/County Outline Settings dialog:
Click on the colored boxes to change the color of the State or County outlines. They display the standard Choose Color dialogs. Click on the Apply button to see changes in the radar display.
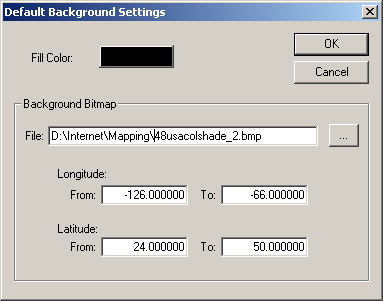
Background...
Displays the Default Background Settings dialog:
The Fill Color is the first layer of the radar display window. Change this color by clicking on the colored box. The Background Bitmap is the second layer of the radar display window. Click on the "..." button to choose a bitmap file using the standard Open File dialog then enter the latitude and longitude range for it.
NOTE: Only 24 bits/pixel Windows bitmap files (.bmp) are supported for the background.