GR2Analyst's Volume Renderer is designed for examining individual storm cells and clusters of cells. Switching volume alpha tables allows you to examine a cell for tornado and hail signatures quickly and easily. In this page, we will design volume alpha tables for these situations.
We start with the Level II data file for the May 3, 1999 Moore tornado. It's included in the installation directory. We want to create an alpha table that produces the following volume display:
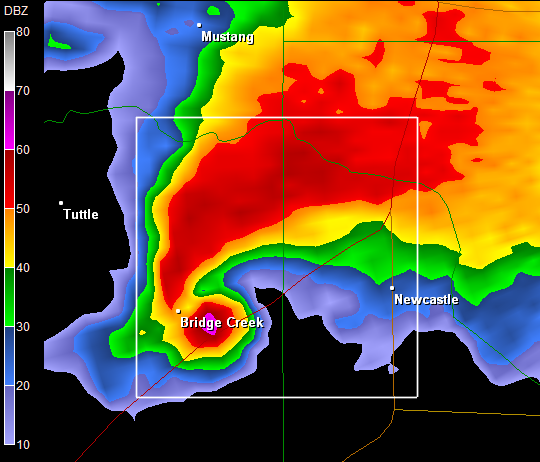
We load the KTLX19990503_235123.Z file into GR2Analyst and zoom into the obvious hook in the cell to the west of the radar site. We select the Volume Mouse mode in the main toolbar then click and drag out to select an area to view in the volume display. The selection area should be similar to this one:
We selected the area to the northeast of the hook because hooks typically hang out of the back of storm cells. When we release the mouse button, GR2Analyst samples the selected area and the Volume Explorer window pops up to show the results. The default alpha table for reflectivity is a simple ramp from zero to 100%, which produces the following volume display:
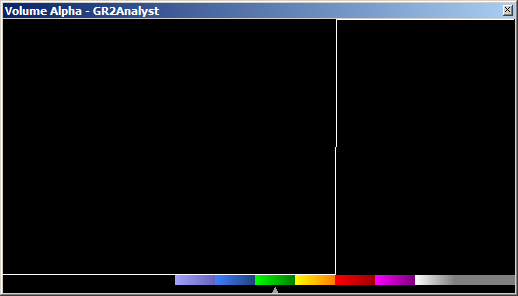
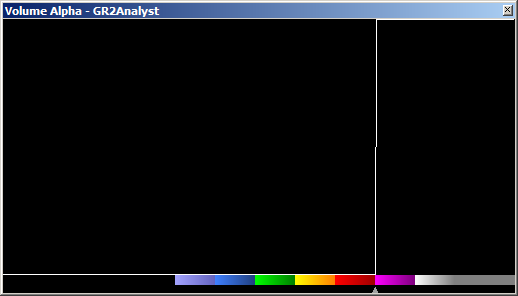
We see that the hook extends upwards into the main body of the cell. While the default alpha table shows anvils and other large scale features, we're really interested in stripping away the lower reflectivities so that we can see inside the cell. To do this, we left-click in the color table part of the Volume Alpha window at 50 dbz and drag left to the edge:
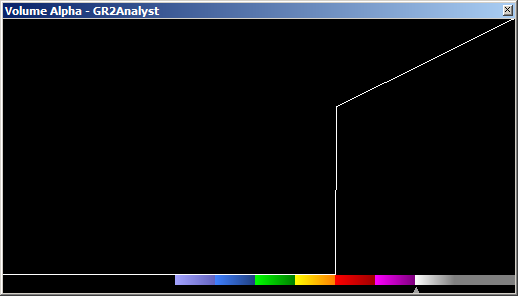
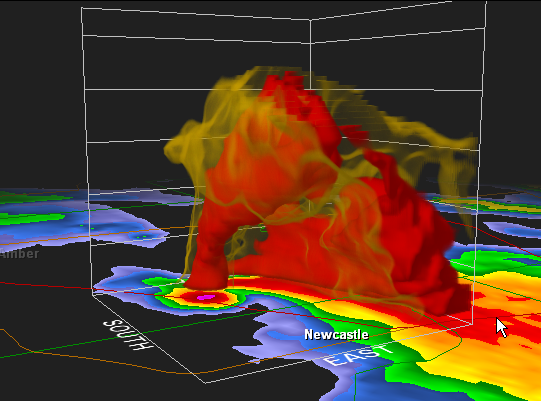
This makes all reflectivities below 50 transparent. The volume display updates to show the changes in the alpha table, revealing a very interesting storm structure:
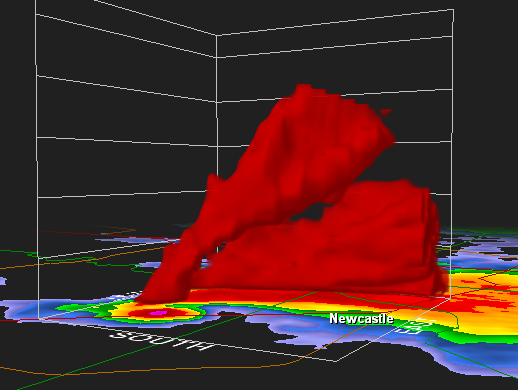
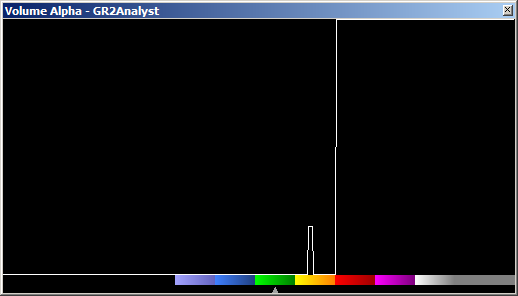
Looks good but the edges are a little soft because the ramp is still present starting at 50 dbz. This makes the edges partially transparent. We sharpen them up by clicking in the volume alpha window at 100% above the 50 dbz and dragging right:
The volume display updates to show the changes:

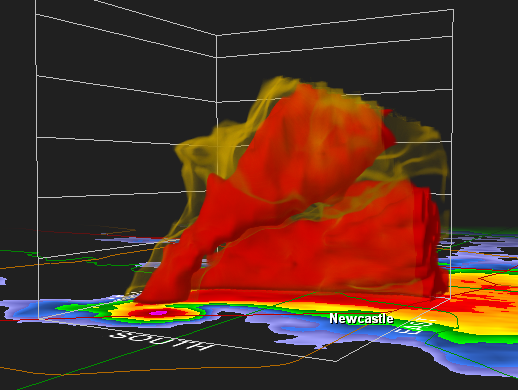
The edges and shadowing (depth queues) are more intense. Basically, we have created an isosurface at 50 dbz with this alpha table. One of the groundbreaking features of GR2Analyst's volume renderer is its full support of transparency, even for very small sections of color tables. We use this to our advantage here to bring out a "halo" of lower reflectivity around the solid 50 dbz surface. This allows us to see more of the storm shape while preserving the core details in the cell. To do this, we left-click at around 25% starting at 43 dbz and drag to the right a small distance to 44 dbz before releasing:
This brings out a thin halo of 43-44 dbz in the volume display:
Now we have our tornado signature detection table defined. This alpha table is useful for general severe weather viewing so we want to save it for future reference. To do this, we right-click in the Volume Alpha window, select "Save Alpha Table...", enter a descriptive name (e.g. "Tornado Table"), then click OK to save it. When you right-click again in the Volume Alpha window, "Tornado Table" appears at the bottom of the menu. Click on it to reload its settings. You can save up to 16 custom alpha tables this way.
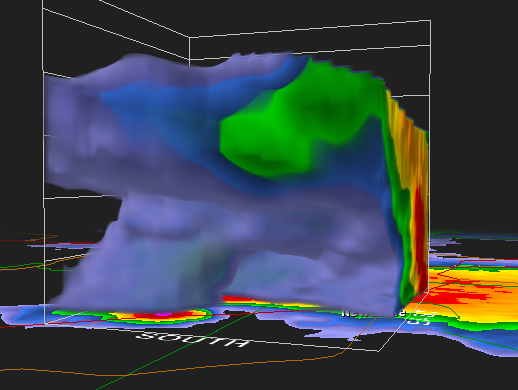
One thing you may have noticed in the volume display is that the storm structure appears stretched/sheared out to the right. This is due to the storm cell's motion. The Nexrad unit takes four or five minutes to scan a radar volume and in that time the cell moves. GR2Analyst automatically corrects for this when sampling the radar volume by using the storm motion vector to slide the upper tilts backwards along the direction of motion. So, we go to the main window, click on the "Set Storm Motion Vector" toolbar button, enter a from Azimuth of 236° and a Speed of 25 kts. then click OK. GR2Analyst resamples the volume and displays the results:
You can see an even more interesting structural detail in this tornadic cell by selecting Isosurface mode and sliding the isovalue pointer up to around 52 dbz. Rotate the volume around so you are viewing from the east and looking down at a 60� angle.
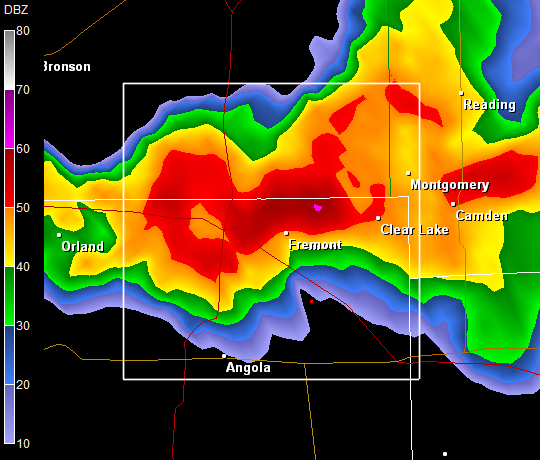
GR2Analyst's volume renderer makes it easy to identify developing hail cores: look for 60 dbz regions above the freezing level. In this example, we'll use the 2005/09/22 at 2311Z volume scan from KIWX:
http://www.grlevelx.com/downloads/KIWX20050922_231148.Z
We start by selecting an area to the northeast of the radar, along the IN/MI border:
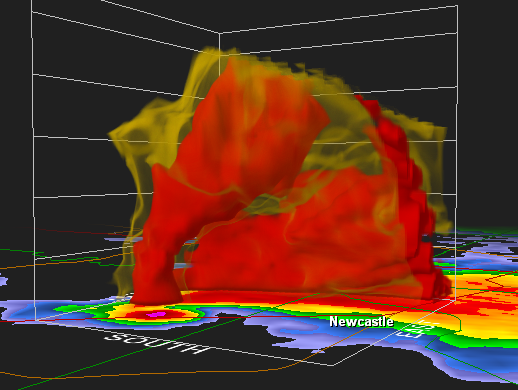
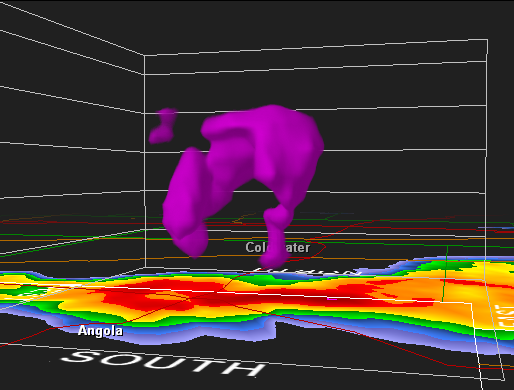
The Tornado Table alpha table defined earlier produces the following volume reflectivity display:
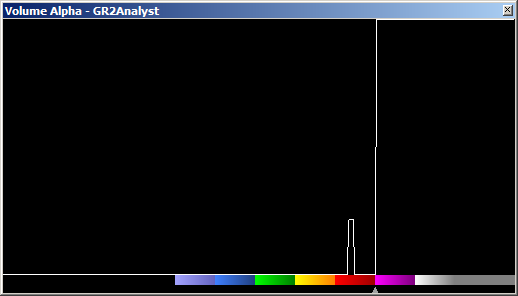
There's a updraft region in the center with 50 dbz overlaying it. While this is an interesting image, we want to find out if there is hail in this cell. So, we modify the Volume Alpha table by setting everything below 60 dbz to zero:
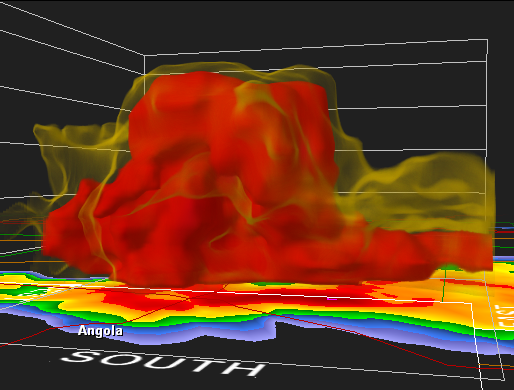
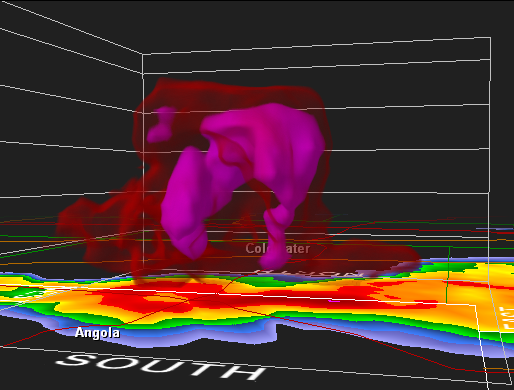
This change exposes the developing hail core:
The hail core extends up to 40,000 ft with a significant amount well above 20,000 ft. At this point, it's useful to bring in a halo of slightly lower reflectivity so that we can see the overall shape of the cell in addition to the hail core. We add 25% alpha from 53 to 55 dbz:
Now we can see the relationship of the hail core to the rest of the cell:
Right-click in the Volume Alpha window and save this very useful alpha table as "Hail Table" so that it can be used in the future.